
Tools Used
- Building Motivation Over Time
- Obtaining a Commitment
- Overcoming Specific Barriers
- Home Visits
- School Programs that Involve the Family
- Work Programs that Influence the Home
Initiated By
- Transport for London
Partners
- Borough of Sutton
- Borough of Richmond upon Thames
- National Health Service
Results
6% (Sutton) to 7% (Richmond) decrease in car modal share, with corresponding increases in cycling, walking and public transport
Case Study PDF

Webinar Materials
Landmark Case Study
Smarter Travel in Outer London: Integrated Marketing in the UK
This case study involves two boroughs in London England, and illustrates the use of integrated marketing. For each target audience, this approach integrates common messaging and synergistic interventions across multiple communication channels, including partners such as physicians, police, NGOs, and chambers of commerce, as well as home visits that provide personalized travel planning. The initiative also includes cycle training, car sharing clubs, workplace and school programs. This case study illustrates the application of traditional social marketing methods, including formative research, setting measurable objectives, audience segmentation and piloting (including a control community.)
Background
The Smarter Travel initiative grew out of a policy directive by the mayor of London to introduce transport demand management (also known as travel demand management, transportation demand management, or simply TDM) into boroughs on the outskirts of that rapidly expanding metropolis.
Smarter Travel was the third major TDM initiative undertaken in the country. Two important TDM attempts were already underway. The first was in London, where the mayor had levied a daily fee on vehicles entering downtown London on weekdays. This coercive measure, in combination with an upgrade of the London public transport system, was proving both effective and popular.
The second was in the middle and north of England, where UK Department for Transport had launched an education approach to transport demand management, called Sustainable Travel Towns (STT), in three relatively free-standing towns. Here, organizers were combining face-to-face and personalized education of the public about their travel options, together with infrastructure improvements to so-called “sustainable” modes of transport (such as walking paths, cycling paths, and public transport). Their hope was this combination of approaches could have a measurable positive impact on a local transport network in a socially acceptable manner. At the time that Smarter Travel was conceived, however, there was not enough data to determine the effectiveness or acceptability of the STT programme.
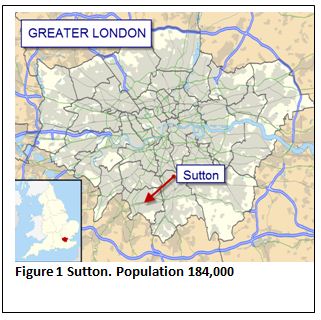
Smarter Travel Sutton
The Smarter Travel initiative was launched in the London borough of Sutton (population 184,000). Sutton is situated about 17 miles south of central London; it covers an area of 17 square miles. Sutton’s hilly topography makes its climate slightly cooler than nearby areas such as the Sussex coast and central London and considerably drier overall than the rest of England – an advantage if one is to promote more walking and cycling. Sutton was ranked as London’s greenest borough at the time, with 11 percent of its area consisting of open land and parks.
Housing in Sutton was characteristically low-density; large, detached and semi-detached properties built in the 1920s and 1930s. However, some areas in the north of the borough were much more densely populated, and the residents suffered high poverty and unemployment rates.
Demographically, Sutton’s population was mostly white; only 15 percent of the population came from ethnic minority backgrounds. Culturally, residents identified themselves according to the town or village to which they lived closest in the borough and not as Sutton borough residents in general.Politically, Sutton was a strong bastion of the Liberal Democratic party.
Sutton residents were both heavy car owners and users. They had one of the highest rates (77%) of car ownership in London. Almost half (46%) of Sutton households owned three or more cars – this was double the national average. They made most of their local trips of about 2 km or less in their personal vehicles.
Sutton’s public transport contributed to this situation. It tended to isolate it from London. It had no London Underground or Overground stations within its boundaries, and no connections with the London Tramlink. The main public transport services in the borough were local rail from its various regional stations and local buses. Direct rail service to and from central London was infrequent and irregular. Commuters relied on several busy local rail routes running between the borough's towns to get them to a transfer point in and out of central London. Few major trunk roads ran through the borough.
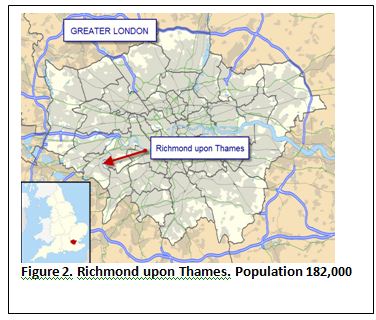
Smarter Travel Richmond
The London Borough of Richmond upon Thames (2006 population 195,000) was the setting for the second phase of the Smarter Travel initiative. It is also located in the southern outskirts of the city, 15 miles southwest of central London and just two boroughs west of Sutton. It covers an area of 22.6 square miles. While Sutton was mostly hilly, Richmond’s distinguishing topographical feature is its 21 miles of river frontage. There are more than 100 parks and open spaces within its boundaries of which 140 hectares are part of the Metropolitan Green Belt of Greater London.
Richmond’s residents were predominantly (90 percent) white. Their average household income was the second highest in London, just after the City itself. Residents of Richmond upon Thames were significantly more active in sports and other fitness activities than other parts of England according to a survey published in Sport England; 29.8% of the population participated at least 3 times a week for 30 minutes.
Housing is Richmond was primarily residential semi-detached and detached dwellings. There were 76,100 households in 2006.
Politically, Richmond switched from predominantly Liberal Democrat to Conservative during the implementation of the Smarter Travel initiative program in its borough.
Richmond’s transport system was well-connected to central London through London Underground and Overground stations within its boundaries, and National Rail stations. It had an extensive local bus network.
Richmond was also distinct from Sutton in that it was a popular tourist destination, hosting approximately 4.5 million tourists every year.
Setting Objectives
The Smarter Travel objectives evolved between the first and second phases of the initiative.
- The initial Smarter Travel Sutton (STS) aimed to decrease the share of journey made by car across the Borough and to key destinations by five percent over three years.
- The second phase Smarter Travel Richmond (STR) aimed to increase the share of journeys made by walking, cycling and public transport across the Borough and to key destinations by five percent over three years.
- There were secondary objectives around CO2 emissions and air quality and public health.
- Both phases of the Smarter Travel initiative sought to learn the feasibility and acceptability of Transport Demand Management (TDM) programs in general and specifically the social marketing approach to behavior change in Outer Boroughs of London.
Getting Informed
Information Sources and Methods
Transport for London (TfL) approved and funded the Sutton phase of the initiative in September 2006. The organizers were given three months to get themselves the information they needed to move forward.
First, they reviewed the results of two comprehensive surveys on Londoners’ travel behavior and attitudes: the 2001 London Area Transport Survey (LATS) and the 2005/2006 London Travel Demand Survey (LTDS). The organizers supplemented this data by commissioning a baseline household survey in September 2006. Surveyors conducted telephone interviews with a sample of 1,500 Sutton residents, and an additional 500 in neighboring Croydon borough, which served as a control area.
They collected information on awareness of travel options, attitudes toward various travel modes, travel intentions, and claimed travel behaviors. They also conducted focus group research to deepen their understanding of specific groups of residents who the surveys identified as being most willing and able to change their behavior.
Awareness, Willingness to Change
The organizers learned that more than half (54%) of Sutton residents were aware of bus routes close to them. Most were aware of the health benefits of cycling and walking and the environmental harm of excessive car use. However, organizers also learned that most (69%) Sutton residents believed that it was essential for them to have access to a car.
Knowing that a gap between awareness and belief existed, the organizers were better informed on where they might need to focus their efforts.
Key Motivators
According to the research, groups of residents differed in what motivated their transport mode choices. For example, parents with school-aged children were motivated to drive their children to and from school out of concern for their security and because of time pressures they faced. However, they did say they were community minded; an appeal to their community values might convince them to review their choices. Research also reported that affluent women in this group could be motivated to adopt transport modes which included healthy activity; they claimed that they would walk and cycle more for the sake of their children.
Another example of a potentially receptive group was overweight and obese residents who were enrolled in or candidates for the National Health Service’s Active Steps program. People in this group were likely to respond to appeals that promoted the health benefits of choosing walking for their transportation mode when it fit their schedule.
On the other hand, men appeared to be motivated to drive their personal vehicle because it gave them the greatest sense of control, privacy, and security. However, they reported being heavily influenced by their work colleagues, so organizers recognized the possibility of using a norm appeal at workplaces to motivate them to change.
Overall, the research showed that the target audiences primarily made transport choices not based on health or concern about the environment but on which mode was fastest and least expensive.
Key Barriers
Most (75%) borough residents did not believe the benefits of cycling and walking outweighed car use. And most (69%) believed that it was essential for them to have access to a car.
Moreover residents reported spending little or no time considering their transport mode options.
The key barriers facing the organizers were:
- The perception that the sustainable options recommended exposed adopters to security risks.
- The perception that time pressures precluded using sustainable transport options.
- The perception that public transport reduced privacy and control to an unacceptable level.
Application of Information Gathered
Based on the information they had gathered and analyzed, Smarter Travel organizers developed an integrated marketing program that:
- Mobilized existing community-based organizations and programs to support the transportation demand management effort. Organizers realized that they could best appeal to the community-mindedness of residents if their program was perceived as being a local community effort.
- Used a combination of advertising, publicity, events, and public relations to bring travel mode consideration to the top-of-mind of residents and to create an atmosphere of community support for making sustainable travel mode choices.
- Appealed to different groups of residents according to their particular motivations for and perceived barriers to making sustainable transport mode choices.
- Intensified travel planning programs in local schools and workplaces to mobilize these key institutions to support transport mode shifts.
- Invested in minor but critical infrastructure enhancements that addressed security concerns and time pressures.
- Engaged each resident face-to-face in a door-to-door personal travel planning effort designed to empower them to feel in control of and secure with alternative transport use.
Targeting the Audience, Segmentation
Based on their research, the organizers chose the following primary and key influencing/ enabling target audiences for the first phase of the initiative:
- Primary audiences:
- Families with school-aged children
- Men employed in Sutton businesses
- Key influencing and enabling audiences:
- School staff
- Business owners within Sutton
- Managers of complementary programs
The organizers chose three segments of their primary audience as target audiences because they felt these segments to be most likely to change their behaviors:
- Hard-pressed families: Mostly adults between 25 and 44 years old with school-age children who they transported to and from school. They viewed their car(s) as a practical necessity. They were not prejudiced against public transport. They made their travel mode choices based on time and cost.
- Affluent women: These people led a hectic lifestyle which put them under considerable time pressure, especially during weekdays. Their primary motivators for choosing the car included convenience, flexibility, and security. They were willing to consider walking with their children to and from school and using public transport on weekends, especially if it enhanced their reputation as a good parent and helped keep their family healthy and active.
- Locally employed men: These men were an opportunistic segment because they said they were strongly influenced by their work colleagues. They disliked travel in general, and valued the control, privacy and security offered by their cars. They did not consider public transport to be a viable alternative for them, but they were likely to consider car sharing, or even walking and cycling. These men said they would likely ignore any transport mode that required them to follow complex directions or learn detailed information.
Smarter Travel Richmond learned a lot of lessons from Sutton, in particular about the value of targeting and segmentation. It looked at those who were dissatisfied with their current choices but who were open to change. Two market segments out of eight were found to be most likely to be responsive to Smart Travel-type interventions; these were named “Evironmentally Aware” and “Cosmopolitan Living.”
Those segments had a range of demographic characteristics which were then compared to the profile and distribution of the population within the borough, and within that, four specific areas were identified where those market segments were particularly highly concentrated.For example, The Cosmopolitan Living segment was described as:
- Having professional jobs and an interest in the arts and culture side of Richmond as well as sport (and skiing particularly).
- Families having a single car or no car
- Using the train to go into London more than average
- Being quite willing and open to changing their behaviours
- Using the following brands: Sainsbury’s, Waitrose, Evening Standard, The Times, The Independent, Volkswagen, Renault, Peugeot
Those target areas represented about 50,000 households.
The organizers chose three segments among their influencing and enabling audience who were most likely to be catalysts for primary audience behavior change:
- School staff: All schools in the UK had already been requested by the national government and the city to develop a school travel plan that would reflect a deliberate effort by the staff, parents, and community to travel safely to and from school and avoid unnecessary negative impacts on the local transport network. The process of creating this plan required substantial effort on the part of staff. The initiative organizers saw an opportunity to achieve their objectives by helping each school to produce a travel plan.
- Sutton employers: there were 62,600 employee jobs provided in Sutton in 2006, consisting of 40,500 full time and 22,000 part-time positions. Business owners were at risk of losing employees and customers if traffic congestion increased in the borough. Smarter Travel organizers saw an opportunity to achieve their goals by supporting businesses to create travel plans. The initiative decided to concentrate its effort on the major employers first.
- Managers of complementary programs: Many groups, including the local police, the national health service, the local chamber of commerce, local environmental charities, and commercial car clubs were already managing their own programs which could contribute to the Smarter Travel initiative achieving its objectives. Rather than set up parallel programs, the organizers decided to reach out to the managers of these programs to seek out mutually beneficial partnerships.
Delivering the Program
The Smarter Travel initiative evolved considerably over the course of six years for three reasons.
- First, the program managers gained valuable experience and confidence with the social marketing approach during the first phase, and applied the lessons they learned to the second phase.
- Second, the venue of the second phase posed unique opportunities and challenges.
- Third, the context within which the initiative took place experienced several major changes, including a change of political administration, a national economic downturn, and a significant increase in the price of fuel.
From its outset, the initiative was structured to be community driven, even though it was initiated by and received partial funding from Transport for London (TfL).
The structure consisted of a Program board, a Project board, and a Project team.
The Program board consisted of members of the Project board, the local Member of Parliament and representatives from key local stakeholder groups; it met twice yearly to discuss strategic issues and provide guidance to the Project board.
The Project board included a senior officer from TfL, LBS, and the project team (see below); they met quarterly to help the program maintain momentum and provide guidance.
The project team, paid for through TfL Local Grant funds, coordinated delivery of program products and services, including travel awareness, marketing, workplace travel planning, school travel planning, and personal travel planning. The team received support from TfL technical officers and other parts of borough government system.
Planning took place as part of an annual cycle of activities, with a feedback loop to ensure lessons were learnt in order for the program to continually improve. The cycle included: strategy development, forward planning program and budget forecasting, program and budget management, project management and staff management, monitoring and evaluation, and reporting, dissemination and improvement.
Year one of the project focused on engaging schools and workplaces to develop travel plans; and launching a personal travel advice campaign.
Year two focused on promoting the health messages associated with walking and cycling, and targeted parents of school-age children, as well as participants in the NHS Active Steps program and gym members. Throughout the initiative, the programs provided the opportunity for the implementation and evaluation of numerous innovative projects.
Coordinating such a wide variety of tasks, activities and partners required substantial project management skills and knowledge. To help the project team members adopt a common language and approach to project management, every team member took the Association of Project Managers introductory course and exam, and received additional training in social marketing.
The program adopted a commonly used framework for understanding how ready people are to change their behaviour, the ‘Stages of Change’ Theory. This model describes behavior change as a process of moving through stages of readiness towards forming new habits. The key steps in the model and the program tools designed for each stage are as follows:
| Stage | Description | Program Tools Used |
| Pre-contemplation | When a person is not considering and has no intention to change their current behavior | Advertising, website, branding |
| Contemplation | When a person is considering options for change | Roadshow events |
| Preparation | When a person intends to change and is preparing to do so | Website, travel planning (workplace, school, personal), cycle training |
| Action | The person attempts the change | Events, travel planning (workplace, school, personal) |
| Maintenance | The person sustains the new behavior until it becomes a habit | Direct marketing, advertising |
Infrastructure Improvements
To reduce infrastructure barriers to walking and cycling a range of improvements were carried out, such as creating safer routes to schools, enhancing key cycling / walking routes, and installing more bicycle parking throughout the boroughs. (Overcoming Specific Brriers)
Public Events
There were a number of public events that were held regularly to bring people in, to engage them in a whole range of activities to help them reconsider their travel options and to help address some of the barriers that they may have perceived around their transport choices.
In 2009 alone, 27,000 Sutton residents attended specific transport-themed events in the borough. (Building Motivation Over Time)
Over the course of the initiative, there was an increasing emphasis on staging these events in the spring and summer (times when the weather was more conducive to people making particularly active travel choices.)
Travel Planning
School travel planning was a key tactic and in both boroughs 100% of the schools participated. The plans were actively integrated into curriculum topics to help these schools justify their engagement with it. Progress was recognized using a bronze, silver, gold scheme. Trial and new habit formation were encouraged through a walk-once-a-week initiative, which provided small incentives and recognition with badges, certificates and vouchers. (Schools Programs that Involve the Family)
Similarly, all of the major employers were engaged in developing travel plans. (Work Programs that Influence the Home)
Personalized travel advice was also offered to individuals. It involved understanding what the journey needs of the individuals were, what the options were, and then encouraging and supporting them in making change. (Overcoming Specific Barriers; Vivid, Personalized, Credible, Empowering Communication)
Active Steps Program
The Active Steps Program was about making an active connection between transport choices and health, particularly through a GP (physician) referral scheme. GPs seeing patients that appeared to have issues that might be related to physical activity referred them to receive personal travel advice. Recruiting the physicians was relatively straightforward, through a partnership with the National Health Service. (Vivid, Personalized, Credible, Empowering Communication)
Car Clubs
Car clubs are initiatives where you can pay an annual fee to join, and then you have access to a pool car or a variety of pool vehicles which you can hire on an hourly basis or on a daily basis at a relatively low cost. They reduce the requirement to own a car purely for the occasional use that you may have for it. Car clubs in London were private businesses that mostly promoted their own services. However, the Smarter Travel program dramatically increased awareness of and use of the clubs.
Evidence from previous evaluation of car clubs in London had demonstrated that those people that joined car clubs were quite strongly inclined to give up their own cars. They reduced their own car use because there was an added barrier to casual use in that they had to then book and go get the cars. This encouraged people to actually think about the actual trip requirement rather than just jumping in the car without thought. On the other hand, car clubs offered members reserved, priority parking- a big incentive in London where there’s a lot of pressure on parking and a high degree of parking enforcement. (Building Motivation Over Time)
Financing the Program
Each borough received a £ 5 million budget to run the three year programs.
Measuring Achievements
Controls for Comparison
Both Sutton and Richmond used control areas for comparison. These were adjacent or nearby boroughs with similar populations and characteristics. Organizers also compared their results to baseline data collected, and data collected from the London Transport Demand Survey (LTDS). The LTDS was a rolling sample survey of households and individuals within Greater London. It had been conducted since 2005/6. It combined socio-demographic data with trip diary-based records of personal travel. The LTDS included annual updates to key trends and indicators, such as the amount of travel by Londoners and modal shares; and a comprehensive geographical analysis of travel behaviour and travel patterns. More information is available at http://www.tfl.gov.uk/corporate/about-tfl/publications/1482.aspx
Methods
Both programs used automatic traffic counters and automatic cycle counters. They also collected weekly bus patronage data from key routes. In addition an independent attitudinal survey took place every September which included 1500 telephone interviews of program area residents and 500 telephone interviews of residents in a nearby comparable control area. Mode share was calculated based on a travel diary survey of 1500 residents and control area residents. Changes in mode share were calculated against a baseline derived from the three year average of the London Travel Demand Survey results for the same locations.
Results
| Results Level | Sutton | Richmond |
| Awareness |
|
|
| Approval |
|
|
| Outputs |
|
|
| Outcomes |
|
|
Contacts
Dan Johnson
Transport for London
danieljohnson@tfl.gov.uk
Stuart Reid
Director of Sustainable Transport
MVA Consultancy
Dukes Court, Duke Street
Woking England GU21 5BH sreid@mvaconsultancy.com
Notes
Among some of the factors identified by the team as contributing to its success in the effective delivery of projects and campaigns on time and within budget were:
- Using evidence-based planning consistently
- Identifying clear goals and objectives which contribute to strategic priorities
- Establishing tangible, time-specific milestones
- Using financial data as indicators for project performance
- Contracting through service agreements and memoranda of understanding
- Issuing performance related contracts for suppliers
- Integrating existing organizations and programs into a coordinated transportation demand management effort.
- Appealing directly to residents to make a specific switch from their car to more sustainable modes of travel for common lifestyle-related events for local journeys.
- Creating an environment of social support for both Smarter Travel choices and program partners.
- Implementing intensified travel planning programs in local schools and workplaces.
Successful, sustainable, non-coercive TDM initiatives such as Smarter Travel require considerable planning, preparation, coordination and collaboration. When designed and delivered professionally, they can achieve significant benefits for the community. But program managers considering this approach should carefully assess their organization’s commitment and capabilities, as well as the political will to support the effort, before undertaking such a project.
Keep in mind the amount of time required to do things right. For example, audience research and segmentation was key to the success of the program. But in Sutton, program organizers were given only three months to get themselves the information they needed and to move forward. In retrospect, they wish they had at least twice as much time.
Also, consider carefully what needs to be measured before, during, and after the initial phase of a TDM program. For example, Sutton organizers wish they had measured how local traffic was affected by the program.
Finally, consider measuring results so that the benefits of reducing car trips are “locked” in; for example make sure that they are not simply replaced by new journeys.
Travel Planning
Of the various tactic used, workplace travel planning was the most cost-effective, followed by school travel planning.
The classic personalized travel plan approach for individuals is a bit of a broadly based approach which can be as crude as knocking on doors and seeing if people are interested. One of the learnings was that that’s not necessarily a very cost-effective way of getting to people. Some of that journey planning increasingly can be delivered through the Internet, and there were Personal Travel Planning websites set up as part of Smarter Travel Sutton.
Referrals
Physician referral was much more effective than promotion through health clubs. That may say something about the role of authority and possibly about the importance of need and motivation on the client’s side as well.
Landmark Designation
This case study was selected as a Tools of Change Landmark case study in 2010 by a peer selection panel consisting of
- Chuck Wilsker, U.S. Telework Coalition
- Daniel Coldrey, Transport Canada
- Elizabeth Allingham, Federation of Canadian Municipalities
- Geoff Noxon, Noxon and Associates
- Jacky Kennedy, Green Communities Canada
- JoAnn Woodhall, Translink
- Lorenzo Mele, Town of Markham
- Ryan Lanyon, Smart Commute
This case study was written in 2012 by Win Morgan.
Search the Case Studies